TRM is PDN analysis plus Thermal Analysis - for any PCB designer and engineer.
TRM software by ADAM Research is a special tool of engineering analysis which takes care about the needs and necessary details of PCB simulations.
Trace temperatures due to Joule heating (current carrying capacity) and board heating by components are calculated from physical principles. Because the user is guided through the software in a way a software assistant does, it is perfectly suited for use by a PCB designer or an electric engineer.
Neither knowledge about numerical methods or gridding techniques is required nor a need to be coupled to a high-price electronic CAD System.
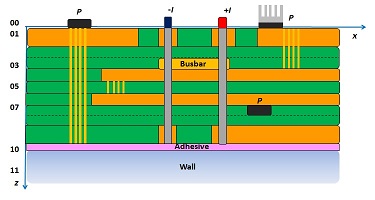 TRM can handle single layers, multilayers, SMD heat sources, embedded components, pins, inlays, busbars, copper thickness, adhesives, plugged and unplugged, blind and burried vias, heat sinks, chassis parts and bolts. Requirement: the PCB should be more or less geometrically flat. Components, heat sinks, cold plates and cables are characterized by thermal parameters.
For a calculation of current-carrying capacity and temperature the following input data are needed:
- layer stack
- conductive pattern of all layers, e.g. Gerber
- hole pattern of plated and non-plated drills, e.g. Gerber or Excellon
- Pins to define current input and output and current value (in Amps)
- Components and the power loss (in Watts)
- External conditions, e.g. ambient temperature, convection type or air speed, vacuum, wall temperature.
As results, you get calculated thermal images (x-y resolution down to e.g. 100 microns) of every layer, detailed maps of current density, maps of potential (and potential drop) and maps of temperature dependent material properties and local heating power. You will see whether the trace width is sufficient, you will recognize bottlenecks with high current density, probably with overheating (or not).
In a transient simulation you can set virtual thermal couples and record the temperatures there. Both power loss and current can be defined by their permanent values, or by any time pulses via spread sheet definition. Comparison shows, that simulation and infrared thermographs usually agree within 10% or better.
Do you need other features? Lets talk and do it!